US shippers’ challenge in securing drayage capacity has eased since the peak eight weeks ago, but tightness in the Midwest and Southeast persists and recent signs possibly point toward more near-term difficulties, according to a new index created by Gross Transportation Consulting (GTC) and Drayage.com.

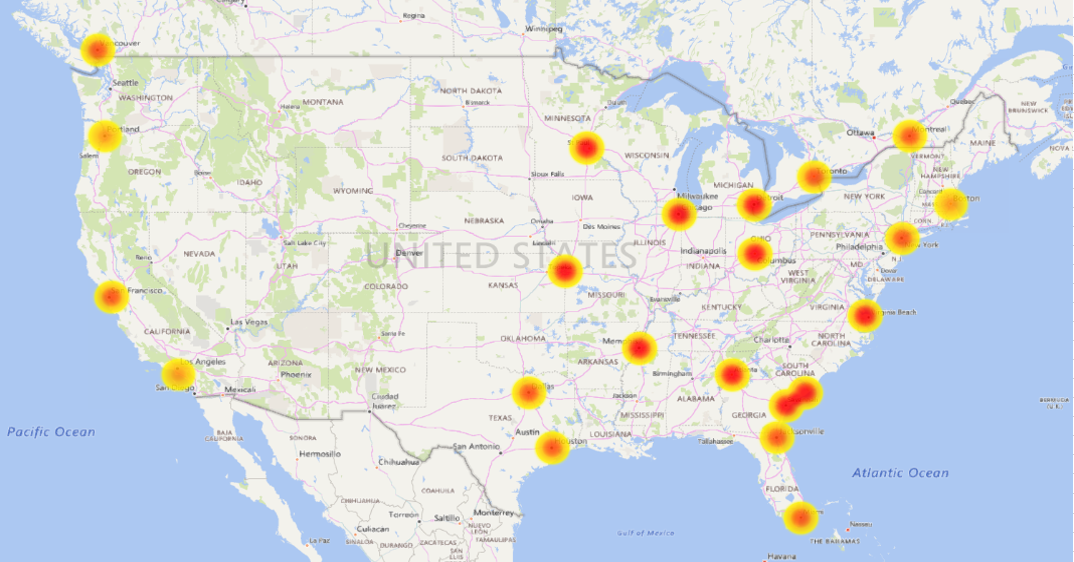
By calculating the number of customer queries for services on Drayage.com, the Drayage Demand Index (DDI) provides an objective gauge of the current situation in the drayage sector, both collectively and by 21 individual key dray markets. An index level of 100 was created by analyzing the average number of customer queries for drayage services in each of the dray markets and nationwide.
The tightness in the South and Midwest is likely a function of the longer drays that typify these regions and confirms industry anecdotal evidence indicating this is where the biggest issues currently lie. The map uses a color code system to assess dray conditions in individual drayage markets. Current conditions range from “high normal” (yellow) to “very tight” (red).
An examination of the US West Coast shows that this area has fared considerably better than most other regions. The ports in California, the Pacific Northwest, and British Columbia have not experienced the market extremes seen elsewhere. This is likely a function of the region’s geography, which sees most dray activity at shorter lengths of haul, with “long-haul” drays a much smaller part of the picture than is the case in the Midwest.
Drayage Demand Index
The “Drayage demand eases after spike” graph tracks the overall DDI for the US/Canadian dray market by amalgamating the demand in 21 individual key dray markets. It illustrates that demand began to accelerate in the fourth quarter, but things really took off in December when the electronic logging device mandate went into effect. After a pause during the holidays, a rapid increase followed, culminating in a peak of 308 at the end of January.

Click to enlarge. Source: Gross Transportation Consulting, Drayage.com
Since the high point, there has been an equally rapid reversal and the DDI has retreated significantly. Most recently (as of April 24) the DDI stood at 202. This is on the edge between “tight” and “very tight.” Current hot spots include Dallas (with a DDI of 410) and Memphis (359). Both of these areas are seeing a surge in demand as the cotton export crop is moving. Minneapolis and Columbus, Ohio, are also seeing DDI values above 300, denoting extremely tight drayage conditions.
Notably, although substantially down from the recent peak, the DDI has been steadily rising during the month of April. It is up 23 points from the recent low of 179 back on April 5. Perhaps this is signaling that despite a relative return to normalcy, swelling volume is still putting a strain on the system. This is a concern because normal seasonality will see demand steadily ramping up from now through the peak season.
The DDI will provide an ongoing view of the drayage market and will be featured each month in GTC’s “Intermodal in Depth” newsletter.
As seen on