West-to-east migration of import routings into North America has been underway for a long time. This is generally regarded as unfavorable for intermodal but how strong is the connection? A look at the the data confirms the general impression with some caveats. With the west-to-east shift showing recent signs of acceleration, the implications could be negative for Inland Point Intermodal.
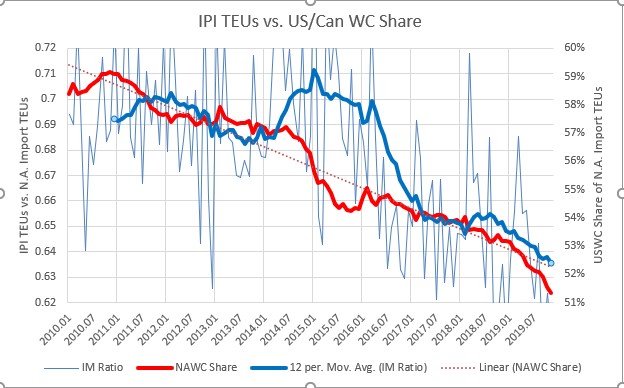
The first chart presents a decade’s worth of data showing the North American (U.S./Canada) West Coast’s share of inbound TEUs (red lines). The heavy red line is the 12-month moving average. This eliminates small month-to-month and seasonal issues while preserving the underlying trend. Although there have been some perturbations due to congestion/labor issues, this trend has been quite stable and relentlessly negative. A west-to-east shift of 7.1% has occurred over last ten years. The west-to-east coast shift in market share has been a bit more than 0.7% per year on average. But the trend has recently accelerated, as shown by the relation to the dotted red trend line. Over the last 12 months we have seen a share shift of 1.1% – about 50% greater than trend.
Intermodal Association of North America data allows us to determine the total number of ISO containers moving in North America (i.e. Inland Point Intermodal, or IPI). It also tells us the length of those containers so we can translate the volumes into the number of TEUs moving. By bumping these numbers up against port statistics, we can gain an idea of the degree of intermodal participation in import (and export) volumes. The blue line on chart 1 illustrates the result. Over the past 9 years, roughly .64 to .72 TEU moved on rail in North America for every import TEU received at a North American port. The heavy blue line is the 12-month moving average which factors out the quite volatile month-to-month movements in this ratio.

The correlation between the red and blue lines is quite good, particularly in recent years. In general, IPI’s share of import TEUs have moved down in concert with NAWC share. The exception is mainly 2014 when IPI participation temporarily rose even as USWC share dropped. But by 2017, IPI had re-aligned with NAWC share. Since then the lines have again been moving in parallel. From the beginning of 2011 to the end of 2019, the intermodal ratio has dropped from about 0.69 down to a bit below 0.64, a drop of over 0.05. Each 0.01 decline represents about 260 thousand fewer IPI moves across the North American rail network, a reduction of a bit less than 3% in IPI movements.
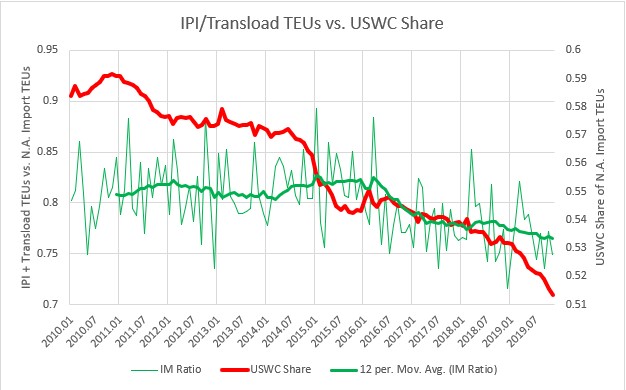
Transloading is undoubtedly part of the IPI story. To gauge its impact, chart #2 portrays a similar analysis with the key difference that the green line also contains our estimate of SoCal transload TEUs moving on the intermodal network. This changes the pre-2016 story but and moderates but does not negate that of the past four years. NAWC share and IPI/Transload TEUs have still shown a strong correlation. But intermodal activity has yet to reflect the recent acceleration in NAWC share loss and the green and red lines have diverged a bit. We conclude that transload cargo is “stickier” than IPI and adds stability to the intermodal picture.

The big question now is whether this divergence can be sustained, or is it simply reflecting a time lag in intermodal’s response. Is the correlation that has held for the past four years is beginning to break down? If not, then we can expect further weakness in International intermodal activity to exceed any declines in import TEUs in the coming months.