Inland Point Intermodal (IPI), the movement of ISO containers with import and export cargos on the rail, has proven to be among the more volatile sectors of intermodal. Although the systems are massive and therefore change comes slowly, over time, patterns can be clearly seen.
The focus of IPI has been moving away from the US West Coast towards the East Coast and Western Canada. This has big implications for individual railroads, but also broader impacts regarding shorter length of haul and diminishing industry revenue per move.
In terms of its share of the total intermodal pie, IPI peaked in 2006 when it accounted for 60 percent of all intermodal revenue moves (Source: IANA ETSO data). Over the next seven years, this share fell rapidly to about 50 percent in 2013 as importers moved toward four or five-corner port routing strategies even as domestic intermodal came into its own. Since that time, IPI share has remained within a narrow range, no lower than 49.9 percent and no higher than 51.5 percent. Thus far in the first five months of 2020, its share stands at 50.3 percent.
IPI movements are concentrated in certain corridors and this fact has not changed. In 2006, the top 10 region-pairs accounted for just under 85 percent of all IPI moves. Thus far in 2020, the top 10 share stands just one percent lower. But although overall IPI share is relatively stable, the world within the IPI universe is anything but. There have been major changes with winners and losers clearly visible.
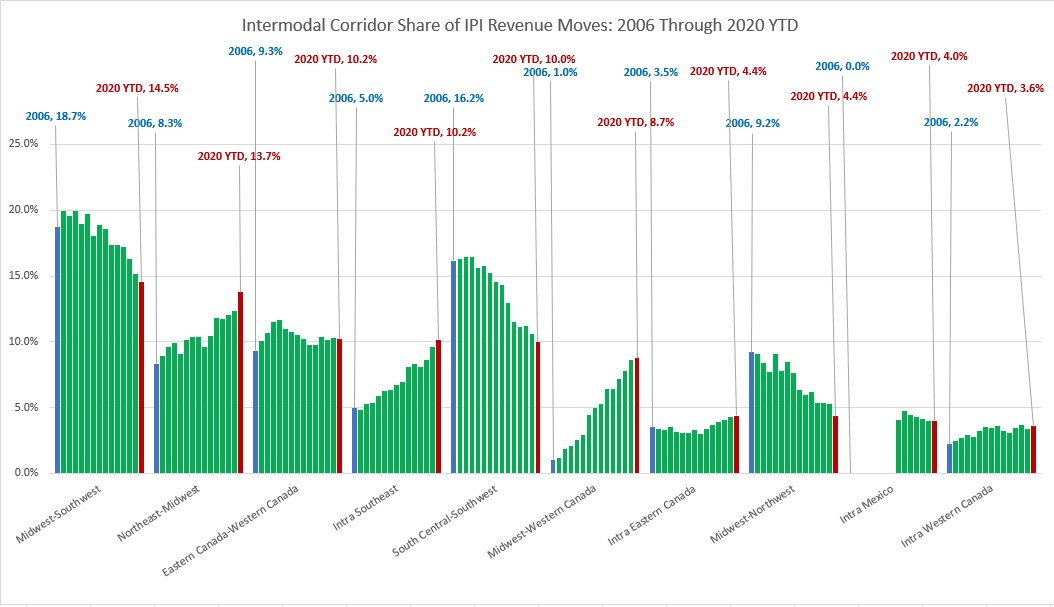
This chart looks at the top 10 IPI corridors thus far in 2020 in terms of share and tracks how that share has evolved over the last 15 years since 2006. Among the big gainers, Intra-Southeast has more than doubled its share, from 5 percent to over 10 percent, reflecting intermodal gains from the inland port initiatives of Savannah and Charleston. This is volume that otherwise would have gone by highway.

Intra-Mexico volume was not reported to IANA back in 2006. Such reporting only began in 2014 when this market accounted for 4 percent of all IPI moves. It moved up to 4.7 percent the following year, but since then has steadily declined to settle back in 2020 to where it started.
Setting these two cases aside, most of the other corridors reflect the ongoing battle for control of the traffic moving into the US interior. The big losers have been the US runs off the West Coast into the American interior. Midwest-Southwest (California) IPI flows have lost 4.2 percent in share, while South Central (Texas) – Southwest has declined an even larger 6.2 percent. Midwest-Northwest (PNW) has also been a big loser, with share dropping by over half from 9.2 percent in 2006 down to just 4.4 percent thus far this year.
The two big gainers in this list have been Northeast-Midwest, reflecting the rise of all-water movements into the east coast (including NY/NJ, Philadelphia, Baltimore and Norfolk), and Midwest-Western Canada due to the success of Canadian rail intermodal services connecting Vancouver and Prince Rupert with Chicago, principally at the expense of US Pacific Northwest ports.
Obviously, this has created winners and losers among the Class I railroads. But even from an overall intermodal perspective, there have been big implications, because the general trend is away from long-haul lanes and toward much shorter lanes.
Simply tracking intermodal revenue loads provides only a partial picture. While revenue IPI movements were a modest 4.0 percent higher last quarter than 15 years prior, during that time IPI revenue-miles dropped by over 10 percent. Average IPI length of haul has declined from 1,634 miles in 2006 Q4 to 1,393 miles in the first quarter of this year.
In sum, some of the changes we have seen in the IPI sector reflect the always-fierce competitive battle between the railroads. But much of the differences stem from large shifts in the intermodal environment over which the sector has very limited control.