One of the main topics of conversation these days is “peak,” as in — will we have a peak season? If we do have one, will it be “normal” or “weak”? It seems that peak season has attained something of a mythological status in the intermodal world. Most peaks are deemed disappointing, but how realistic are the expectations? Just what should we expect with regard to the average peak season? And how is the current peak looking in comparison?
How much higher is the typical peak season week versus the average week? 10%? 25%? How about…6.4%?
The Association of American Railroads (AAR) weekly data allows us to provide a pretty good answer to the question. The graph below averages the weekly North American intermodal originations across the 52 weeks of the year as reported by the AAR for the most recent 10 “normal” (i.e. pre-pandemic) years, 2010 through 2019. This is the red-colored line. What does it tell us?
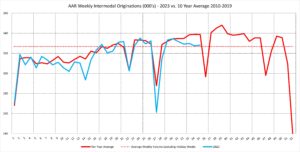
First take out the holidays. There are six weeks of the year that contain major holidays: New Years, Memorial Day, Independence Day, Labor Day, Thanksgiving, and Christmas. If we average the 45 remaining “normal” weeks of the year, the average volume over 10 years was 327,000 intermodal originations per week. This is shown on the chart as the dotted purple line.
That is what a normal peak season looks like.
Keep in mind that these AAR numbers track total intermodal activity and are therefore a composite of both international and domestic. There are differences between the two sectors. Based on the monthly data published by the Intermodal Association of North America (IANA), after adjusting for working day effects, we know that international intermodal (IPI) volume is strongest in September and falls off steadily through the balance of the year. Meanwhile, domestic intermodal ramps up more slowly and is strongest in October. It then declines through in November and December, but, again, considerably more slowly than international.
Now let’s look at 2023 thus far (blue line). Through the 4th of July, things were generally following the normal script, although activity was on the weak side late in the first quarter. The dip in Week 14 can be ignored as it was an aberration caused by a glitch on the part of Ferromex, which reported a huge 63% drop in reported volume for that week only. The July 4th holiday dip was unusually deep, due to the compounding effect of the Canadian port strike during the first two weeks of July on top of the holiday.
However, volume rebounded normally after the holiday week and once the strike was settled. But then in Week 30, as the calendar turned from July to August, volume started to head south when it should have been rising. A wide gap has opened in recent weeks between “normal” and “current” volume. Given the timing, it seems likely that when we get the August numbers from IANA, we will see that the weakness was in IPI and transloads.
But all is not yet lost. As previously noted, domestic doesn’t always follow the lead of international. Transloads, while a significant driver of domestic intermodal, only account for perhaps 20% of domestic activity, and domestic intermodal moves a lot of other things besides retail goods. So, we’ll be looking at the August numbers to see whether domestic intermodal activity held up better than international. Of course, one big driver of domestic intermodal volume is automotive, and if the looming strike against the “big three” U. automakers comes to pass, then domestic intermodal will surely take another big hit. All-in-all, certainly more down-side risks than upside potential for the balance of the year.
Contact Larry Gross at lgross@intermodalindepth.com.