US West Coast ports took a big hit in terms of import share during the post-pandemic surge as importers fled congestion and delays. But now the stars are aligning in the opposite direction. Substantial tailwinds are gathering that could, at least in the near term, dramatically boost West Coast share. Import volumes could easily reach unprecedented levels. The question is, will the supply chain – the ports, chassis providers, dray carriers and railroads – be able to handle it?
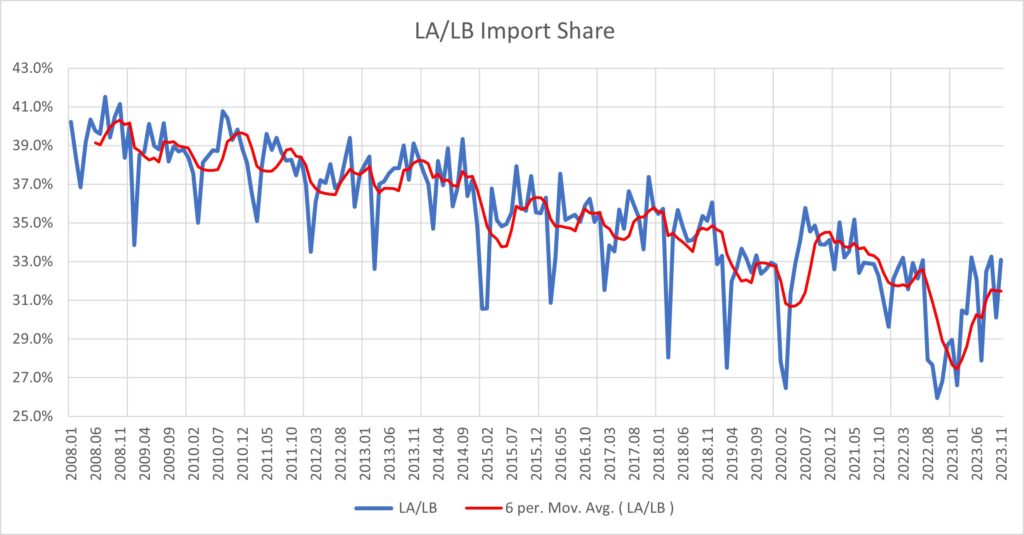
Looking at Los Angeles/Long Beach in particular, the long-term trend of declining market share is well known. The descending trend is clearly visible in the import share chart, especially when looking at the six-month moving average trend (red line). Import share was above 39% back in 2008. Although the region’s import share has recovered from the depths of 2022, most recently it was still slightly under 32%.
Where do we go from here? All-water routing from Asia to the East Coast of North America has suddenly become much more difficult and expensive, with no near-term relief in sight. Drought-related capacity constraints have constricted volume moving through the Panama Canal and raised costs. Now the major alternative, westward through the Suez, has also been choked off by threats to shipping in the Red Sea by the Houthi rebels of Yemen. The trip around the Cape of Good Hope in South Africa is the alternative, adding substantial time and, more importantly, cost. The all-water option from Asia to the East Coast of North America has suddenly become fraught and much more expensive. The cost differential between the West and East coasts has been diminished and therefore the routing calculus is also changing.
The obvious “back to the future” solution is to retreat to the standard operating procedure of the recent past before there was such a thing as a “four corner” or “five corner” strategy. Bring the freight into the West Coast with intermodal movement beyond to the final destination.
Of course, no one knows how long the Suez situation will last or how bad it will get. While a coalition naval protective force is being assembled, the risks of broader conflict are significant. But even if this problem is eventually defused, one way or another, another threat to the East Coast looms in the form of a potential strike when the International Longshoremen’s Association’s (ILA) current contract expires at the end of September. The closer we get without a resolution, the higher the rerouting pressure will become.
Potential stress in Southern California
What might a surge look like? Turning back to the LA/LB market share chart, we can see that post-pandemic, the six-month share approached 35% with selected months at higher levels before congestion and delays took their toll. It’s easy to conceive under the current conditions that share could return to that level. As a “what-if” analysis, assume moderate 3% growth in North American import TEUs, normal pre-COVID seasonality and LA/LB share increasing from current levels to 35% by March.
The result is shown in the second chart, which tracks monthly import TEUs arriving in the San Pedro Bay ports from 2008 through the present, and then shows what volume might look like as share moves up to 35%.
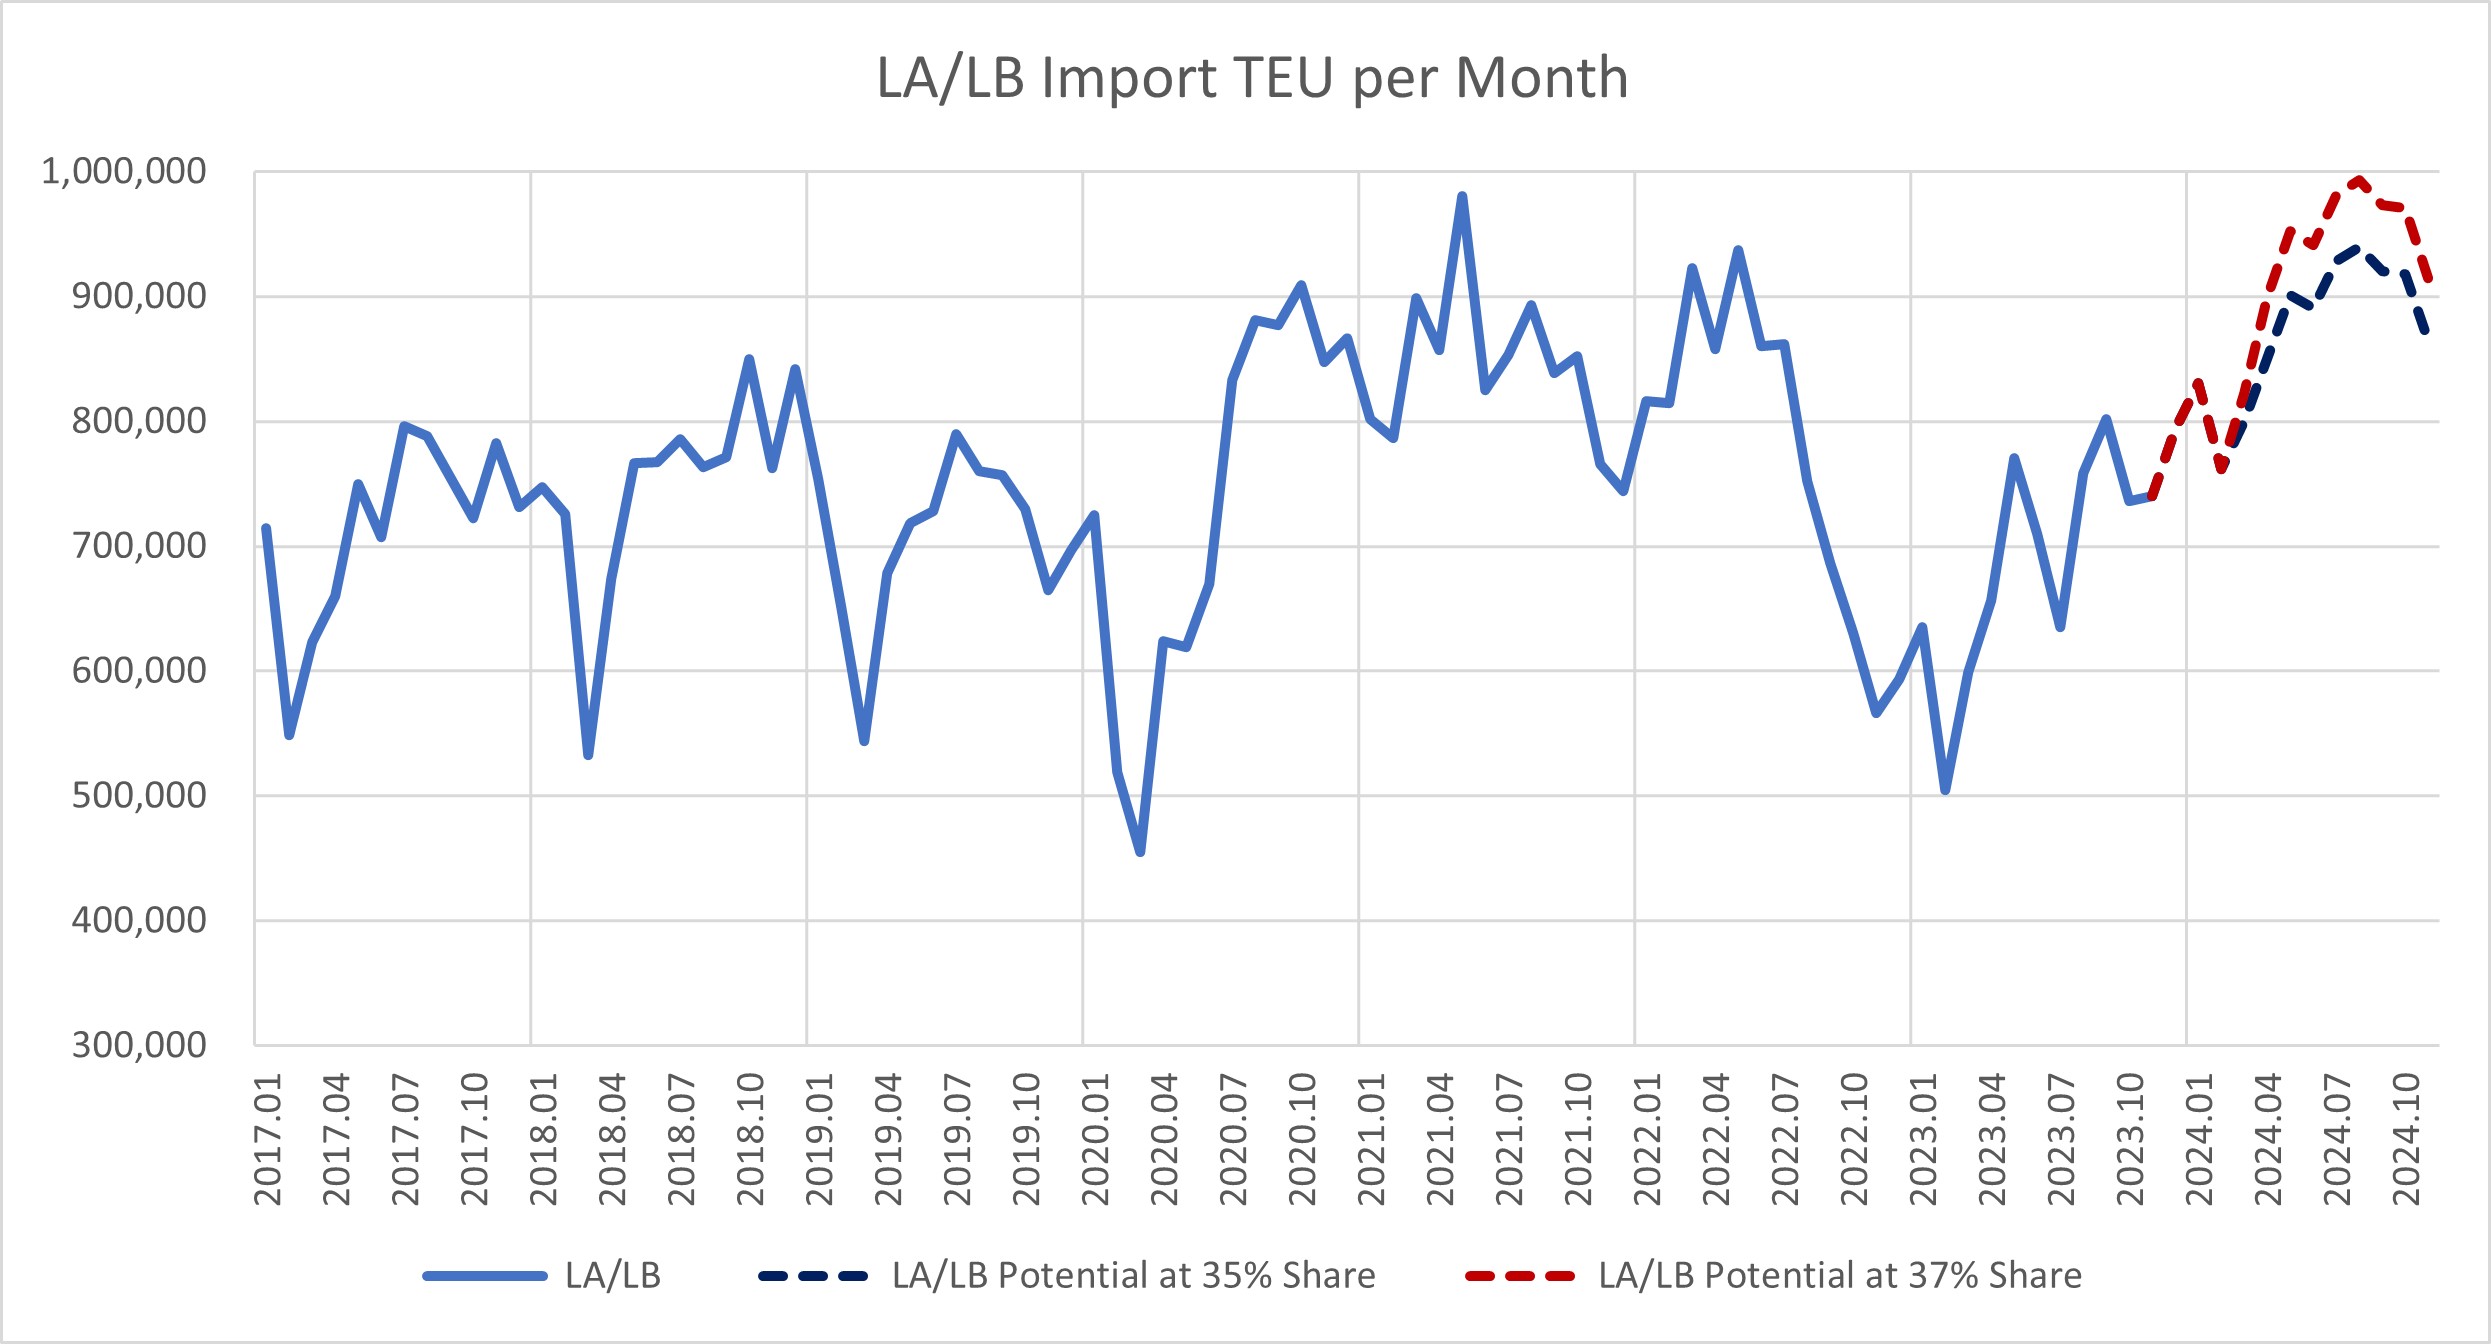
During the post-pandemic surge, import TEUs exceeded 900,000 in only four months, and in each case, that volume could not be sustained for more than one month. Under the 35% share scenario, volume hits 900,000 TEUs in May, dips slightly in June and then stays above 900,000 for four months straight.
This incremental volume will be bound for distant destinations. Transloading will stand to benefit. Domestic intermodal providers will have plenty of boxes, and probably chassis, available, but the transload sector’s ability to ramp up will be limited by available capacity at transload facilities. Most likely the brunt of the increase will be looking for intact intermodal movement inland, i.e. IPI.
Under the current circumstances, moving back up to a share of 35% doesn’t seem like that much of a stretch. What if things get a bit more extreme? What if share goes back up to the 37% level that was routine just 10 years ago?
Let’s assume the share increases steadily from today up to 37% in May. As shown on the volume chart, the result is that volume moves above 900,000 import TEUs in May and never falls below that figure for the rest of the year. In fact, August sees imports of 993,000 TEUs, just shy of one million. The ability of the region to handle such a surge is questionable.
The situation will be acute in California, but less so at inland locations. Intermodal terminations in the Midwest, for example, won’t change much in total, although the direction from which they are coming certainly will. Western railroad terminals will need to operate at peak form, but sufficient chassis should be available in the region as volume coming in from the East will diminish. We also won’t see a repeat of the clogged warehouses that slowed chassis turns during the last surge.
This “back of the envelope” analysis indicates a good likelihood of stress in Southern California. Importers might be well advised to think beyond the obvious and look at secondary routings such as via the Pacific Northwest and Western Canada. These ports are down from previous levels and might have more ability to absorb new volume. The decisions that are being made today will only become obvious in 30 to 60 days when the volume hits our shores. It could be a wild ride.
Contact Larry Gross at lgross@intermodalindepth.com.